In my previous posts, I have shown how you can run a modern LLM reliably with reasonable speed using the cost-effective CPU-based Ampere platform in Oracle Cloud.
Specifically, we ran the Ampere optimized llama-server container to serve a quantized translation model, and access the endpoint via Python OpenAI-style API.
In this blog post, let’s implement monitoring and notification to track LLM-specific Performance Indicators using OCI’s free-tier Monitoring and Notification offerings. By combining llama-server metrics with resource usage (CPU, memory, network, disk I/O monitoring), we can surface patterns such as correlation of prompts, latency and resource usage by timestamp, as well as spot saturation windows.
We will also look at different ways of visualizing the collected metrics and their pros and cons. Finally, we will setup alarms to inform us if something goes astray (e.g., “Token speed dropped below 5” or “CPU usage peaks at 95% for 5 minutes).
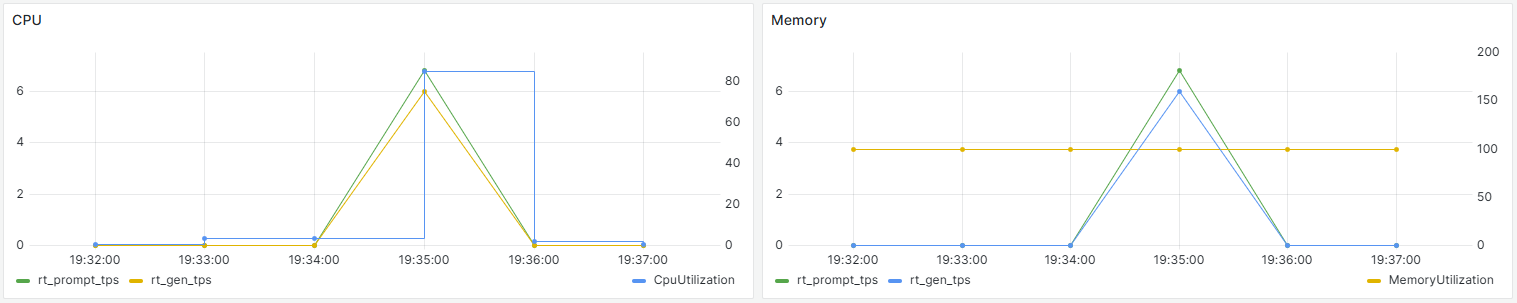
By the end of this blog post, we will have created this dashboard interpolating CPU and memory usage with inference throughput metrics. This gives us a unified view of both our inference engine and system performance.
Architecture Overview
This setup gives us a baseline: VM health + custom inference metrics + alerts, all within free tier.
Compute: Always Free Ampere A1 (4 OCPUs, 24GB RAM) running Ampere optimized
llama.cppcontainer.Metrics:
llama-serverexposes Prometheus-formatted data athttp://localhost:8080/metrics(TTFT, TPS, latency, prompt/response sizes).Collection: A Python script parses
llama-servermetrics automatically and continually, and publishes them as custom metrics to OCI Monitoring via the API. This alleviates us from manually pushing metrics via the CLI (oci monitoring metric-data post).Visualization: OCI free-tier provides several Monitoring visualization tools:
- Service Metrics : a prebuilt read-only dashboard displaying service infrastructure metrics only.
- Metrics Explorer : can pull both instance and custom metrics and build charts from multiple queries. However you cannot save the charts.
- Console Dashboard: a canvas where you can build rich dashboard from multiple widgets side-by-side. However, each widget only supports a single query, making correlation in the same chart impossible.
We will be using Metrics Explorer to perform this:
- VM metrics (CPU utilization, memory utilization, network throughput, disk I/O) are already collected by Oracle Cloud Agent (the standard agent installed on all VMs) and available in Monitoring
- Custom
llama-servermetrics will appear under our custom namespace (e.g.,llama_cpp) in Monitoring → Metric Explorer.
- Mesh and query VM metrics with custom
llama-servermetrics in OCI Metric Explorer, OCI Console Dashboard and Grafana. - Setup alarms for metric thresholds right in Metric Explorer to route alerts with OCI Notifications topics. (e.g., TPS <3 for 5 minutes or CPU > 90% for 5 minutes).
We will also self-host Grafana to take advantage of a richer and more customizable dashboard that supports overlaid metrics in a single panel for correlation. And of course we can save it!
Notifications:
- Set a topic for notification via email, https endpoint, Slack, PagerDuty, etc.
- Create an alarm that triggers on rules, and attach it to a topic for firing.
Performance Metrics
- Time To First Token (TTFT): How long the user waits before the text starts appearing. This is the biggest factor in perceived latency.
- Tokens Per Second (TPS): The “throughput” of our model.
- Total Tokens per Request: Helps in understanding usage patterns and potential cost (if we are using a paid API).
Quality & Reliability
- Request Latency: The total time from “Enter” to the final stop token.
- Error Rates: How often does the
llama-servertimeout or crash under load? - Queue Depth: If multiple users hit our frontend, how many requests are waiting for the CPU to be free?
OCI Observability Free Tier Limits
In this post, we will use Monitoring, Monitoring API, Notification, Metrics Explorer and Console Dashboard from the following free OCI offerings:
| Feature | What it is | Free Quota |
|---|---|---|
| Monitoring | Query metrics and manage alarms to monitor the health, capacity, and performance of cloud resources. | 500 million ingestion datapoints/month, 1 billion retrieval datapoints/month |
| Monitoring API | allows programmatic access to retrieve metrics, publish custom metrics, and manage alarms for assessing the health and performance of your cloud resources. We will be using the OCI Monitoring SDK Python wrapper to publish raw metric data points to the Monitoring service | ~50 calls/sec per tenancy, 50 metric streams per request. (A metric stream = unique combination of namespace, metric name, dimensions, and metadata), 50 data points per metric stream, 1 MB max request payload size |
| Notification | publish/subscribe (pub/sub) service that lets you know when something happens with your OCI resources. Using alarms, event rules, and service connectors, you can get human-readable messages through supported endpoints, including email, Slack channels and text messages (SMS). | 1 million sent through https per month, 1000 sent through email per month |
| Logging | The Logging service provides a highly scalable and fully managed single pane of glass for all the logs in your tenancy. | 10 GB log storage per month |
| Application Performance Monitoring | provides a comprehensive set of features to monitor applications and diagnose performance issues. | 1000 tracing events and 10 Synthetic Monitoring runs per hour |
| Console Dashboard | Create custom dashboards in the OCI Console to monitor resources, diagnostics, and key metrics for your tenancy. | 100 dashboards |
| Service Connector Hub | A cloud message bus platform that offers a single pane of glass for describing, executing, and monitoring interactions when moving data between Oracle Cloud Infrastructure services. | 2 service connectors |
Steps to Implement Observability
Step 1: OCI Console Setup (Resources and Permissions)
1.1 Obtain OCIDs
Log in to OCI Console → top left hamburger menu → Compute → Instances -> Click on the VM where we want to monitor -> Details.
- Note the OCID of the Ampere VM instance.
- Do the same thing for the Compartment where the VM resides.
- Note the OCID of the Ampere VM instance.
1.2 Configure Instance Principals
To allow a VM to “talk” to the Monitoring service, we must create a Dynamic Group and a Policy.
Dynamic Group:
- Menu → Identity & Security → Domains -> default -> Dynamic Groups (on top) → Create Group
- Name:
LlamaServerGroup - Rule:
ANY {instance.id = 'ocid1.instance.your-vm-ocid'}
- Name:
- Click Create.
Regular groups and policies are designed for user authentication (e.g., via console login or API keys). For code running on an instance to call OCI services securely without keys, we must use instance principals, which rely on dynamic groups.
- Menu → Identity & Security → Domains -> default -> Dynamic Groups (on top) → Create Group
Policy: Add a group policy that allows an instance to write custom metrics in a chosen namespace (e.g.,
llama_cpp).Menu → Identity & Security → Policies → Create Policy (root compartment).
Name:
observability-policy.In Policy Builder, use the manual editor to input the following statements to let you publish and query custom metrics.
Allow dynamic-group Default/LlamaServerGroup to use metrics in tenancy
Allow dynamic-group Default/LlamaServerGroup to manage log-content in tenancy
Allow dynamic-group Default/LlamaServerGroup to read log-groups in tenancy
For publishing custom metrics, the minimal permission is
use metrics; for log ingestion, it’s typicallymanage log-content. Broader verbs likemanage metricsormanage logging-familycan be used but are less least-privilege. We can also add awhereclause to restrict access to a specific namespace, e.g.,Allow dynamic-group Default/LlamaServerGroup to use metrics in tenancy where target.metrics.namespace='llama_cpp'. In addition, we can replacetenancywithcompartment id <compartment-ocid>if your compartment is not the root.
1.3 Enable the Agent Plugin
Use the Custom Logs Monitoring plugin, which handles both custom logs and custom metric scraping.
- Navigate to your Compute Instance details page.
- Click the Management tab.
- Under Oracle Cloud Agent, ensure Custom Logs Monitoring is toggled Enabled. If not, click the 3 dots on the right to enable it. (It may take 5–10 minutes to initialize).
Step 2: Instance Setup (Dependencies and Llama.cpp)
SSH into your VM:
2.1 Install OCI SDK and helpers
pip3 install oci requests 2.2 Emit Metrics from Llama.cpp Server
The llama-server --metrics flag creates a Prometheus endpoint at http://vm-public-ip:8080/metrics. Instead of installing a full Prometheus server, we use a Python script to “scrape” that endpoint and POST to OCI Monitoring as custom metrics in namespace llama_custom. We will keep dimensions rich so we can correlate later.
Note that if you have a paid OCI account, you can configure the OCI Management Agent to scrape that endpoint instead of implementing a Python script yourself.
For consistency and maintainability, we will use Docker Compose to run the container with this docker-compose.yml configuration.
services:
  llama-server:
    image: amperecomputingai/llama.cpp:latest
    container_name: llama-server
    restart: unless-stopped
    tty: true
    stdin_open: true
    ports:
      - "8080:8080"
    volumes:
      - /home/opc/llama-logs:/logs
      - /home/opc/llama-cpp/models/:/models
    command: >
      -m /models/plamo-2-translate-Q4_K_4.gguf
      --host 0.0.0.0
      --port 8080
      --ctx-size 4096
      --metrics
      --log-file /logs/llama-server.log
Create log folder with
mkdir /llama-logsand make sure we have write permission to it withchmod 777 /home/opc/llama-logs.Run the container with
docker compose up -d, then make sure it is outputting log withdocker logs -f llama-serverSend an inference request to the server.
Test
/metricsendpoint withcurl http://localhost:8080/metrics. The following is returned, confirming that the metrics are emitted.
> curl http://localhost:8080/metrics | grep llamacpp

# HELP llamacpp:prompt_tokens_total Number of prompt tokens processed.
llamacpp:prompt_tokens_total 439
# HELP llamacpp:prompt_seconds_total Prompt process time
llamacpp:prompt_seconds_total 204.195
# HELP llamacpp:tokens_predicted_total Number of generation tokens processed.
llamacpp:tokens_predicted_total 350
# HELP llamacpp:tokens_predicted_seconds_total Predict process time
llamacpp:tokens_predicted_seconds_total 112.757
# HELP llamacpp:n_decode_total Total number of llama_decode() calls
llamacpp:n_decode_total 352
# HELP llamacpp:n_busy_slots_per_decode Average number of busy slots per llama_decode() call
llamacpp:n_busy_slots_per_decode 1
# HELP llamacpp:prompt_tokens_seconds Average prompt throughput in tokens/s.
llamacpp:prompt_tokens_seconds 2.14991
# HELP llamacpp:predicted_tokens_seconds Average generation throughput in tokens/s.
llamacpp:predicted_tokens_seconds 3.10402
# HELP llamacpp:requests_processing Number of requests processing.
llamacpp:requests_processing 0
# HELP llamacpp:requests_deferred Number of requests deferred.
llamacpp:requests_deferred 0
Step 3: Deploy Monitoring Script
We will create a Python script that takes numeric values (TTFT, TPS, latency, prompt length, etc.) from llama‑server’s /metrics endpoint, and publishes them into OCI Monitoring as custom metrics under namespace llama_custom.
Metrics are time‑series data points (value + timestamp + dimensions) that are perfect for quantitative monitoring, dashboards, trend analysis, threshold alerts and correlation with system metrics. For example, we can ask the question “What was the average TPS over the last 10 minutes?” with the metrics we collect, so that we can perform this action: “Alert me if TPS sinks.”
A few notable points in this script:
By including the
instance_idas a Dimension, we can later go to the OCI Dashboard and filter by Instance. For example, if we scale to 2 or 3 VMs later, we can see them individually or aggregated.Unlike
docker logs -f llama-serverwhich shows the metrics for each individual request, thellama-serverPrometheus metrics are cumulative counters (they only go up) such as total time elapsed or total tokens. If you divide these, you get an average since the server started. If the server has been idle for a long time, the “Total Seconds” in the denominator is huge, which actually makes the cumulative average very low. However, if you just started or just ran a massive batch, the mathtotal_tokens / total_secondscan spike because it’s an all-time average, not a “per-second” real-time snapshot. Or, thellamacpp:prompt_tokens_secondsandllamacpp:predicted_tokens_secondsonly present “all-time” averages of throughput. To get the metrics of the current request, we will need to calculate the Delta (change) between the last request and this one.sleep(10)provides more accuracy as we are taking snapshots every 10 seconds. If we usesleep(60), and a massive spike in TPS happens at second 15 and is gone by second 60, a 60-second script will miss it entirely. By polling every 10 seconds and sending the Maximum to OCI, we are guaranteed that the highest burst of activity within that minute is preserved on our graph. A 60-second sleep is essentially “sampling” rather than “monitoring.” It’s like taking a photo once a minute instead of watching a video; you miss everything that happens between the frames.I implement a Buffer/Chunk/Batch logic to scrap 12 custom metrics every 10 second, buffer them, then chunk them into smaller batches before pushing to the OCI Telemetry Ingestion endpoint so everything falls under the API’s per-call limit.
- Chunking (
all_datapoints[i:i + 40]) is due to OCI Monitoring API’s limit of 50 metric streams per singlepost_metric_dataAPI call. In our case, 12 metrics × 6 samples (=72 streams). So I split them into two API calls (40 streams + 32 streams) to satisfy OCI’s requirement. - Batching multiple metrics in one request is to reduce API calls under ~50 requests/sec per tenancy limit.
- Buffer Reset: By clearing the
mini_batchesbuffer only after the push attempts, we ensure no data is lost during a temporary network blip. - At our rate of 12 metrics x 6 per minute, we will use ~3.1 million datapoints per month (0.62% of the free quota)
- Chunking (
3.1 Metrics Publisher Script (/home/opc/llama-logs/llama-metrics.py)
import oci
import requests
import time
from datetime import datetime, timezone

# --- CONFIGURATION ---

# Instance principals authentication
signer = oci.auth.signers.InstancePrincipalsSecurityTokenSigner()
# Use the telemetry-ingestion endpoint specifically for posting data
endpoint = "https://telemetry-ingestion.us-phoenix-1.oraclecloud.com"
client = oci.monitoring.MonitoringClient(config={}, signer=signer, service_endpoint=endpoint)

namespace = "llama_custom"
compartment_id = "ocid1.tenancy.oc1.abc"
instance_ocid = "ocid1.instance.oc1.phx.abc"

# Track last state to calculate Delta (Real-time speed)
last_metrics = {
    "p_tokens": 0, "p_secs": 0,
    "g_tokens": 0, "g_secs": 0
}

# Buffer to store 10-second samples (all metrics) before pushing to OCI
mini_batches = []

print(f"High-frequency publisher started (10s polls, 60s push). Tracking deltas for real-time metrics targetting {endpoint}...")

while True:
    try:
        # Scrape metrics from llama-server
        resp = requests.get("http://localhost:7775/metrics", timeout=5)
        resp.raise_for_status()

        current_scraped = {}
        for line in resp.text.splitlines():
            if line.startswith("llamacpp:"):
                parts = line.split(" ")
                name = parts[0].split(":")[1]
                current_scraped[name] = float(parts[1])

        ts = datetime.now(timezone.utc)

        # Helper to calculate real-time TPS based on the change since last minute
        def calc_delta_tps(curr_t_key, curr_s_key, last_t_key, last_s_key):
            t_delta = current_scraped.get(curr_t_key, 0) - last_metrics[last_t_key]
            s_delta = current_scraped.get(curr_s_key, 0) - last_metrics[last_s_key]

            # Update state for next calculation
            last_metrics[last_t_key] = current_scraped.get(curr_t_key, 0)
            last_metrics[last_s_key] = current_scraped.get(curr_s_key, 0)

            if t_delta > 0 and s_delta > 0:
                return t_delta / s_delta
            return 0.0

        # Calculate Real-Time Prompt TPS
        current_scraped["rt_prompt_tps"] = calc_delta_tps("prompt_tokens_total", "prompt_seconds_total", "p_tokens", "p_secs")
        # Calculate Real-Time Generation TPS
        current_scraped["rt_gen_tps"] = calc_delta_tps("tokens_predicted_total", "tokens_predicted_seconds_total", "g_tokens", "g_secs")

        # Store current snapshot in buffer
        mini_batches.append((ts, current_scraped))

        # Batch Push to OCI: Every 6 samples (approx 60 seconds)
        if len(mini_batches) >= 6:
            all_datapoints = []
            for timestamp, metrics_dict in mini_batches:
                for name, value in metrics_dict.items():
                    all_datapoints.append(oci.monitoring.models.MetricDataDetails(
                        namespace=namespace, compartment_id=compartment_id,
                        name=name, dimensions={"instance_id": instance_ocid},
                        datapoints=[oci.monitoring.models.Datapoint(timestamp=timestamp, value=value)]
                    ))

            # Splits into chunks of 40 (OCI allows max 50)
            for i in range(0, len(all_datapoints), 40):
                chunk = all_datapoints[i:i + 40]
                post_data = oci.monitoring.models.PostMetricDataDetails(metric_data=chunk)
                client.post_metric_data(post_data)

            print(f"[{ts.strftime('%H:%M:%S')}] Successfully pushed {len(all_datapoints)} streams in chunks.")
            mini_batches = [] # Clear buffer only on success

    except Exception as e:
        print(f"Error: {e}")

    time.sleep(10)
We can run the script to test:
python llama-metrics.py3.2 Run as Services
Configure the script as systemd services so it auto-starts on reboot.
sudo tee /etc/systemd/system/llama-metrics.service > /dev/null <<EOF
[Unit]
Description=Llama Metrics Publisher
[Service]
ExecStart=/usr/bin/python3 /home/opc/llama-logs/llama-metrics.py
Restart=always
[Install]
WantedBy=multi-user.target
EOF

sudo systemctl daemon-reload && sudo systemctl enable --now llama-metrics
Check the logs immediately:
sudo journalctl -u llama-metrics -fYou should see “Successfully pushed 72 streams in chunks.”.
Step 4: Build a dashboard with VM + llama.cpp metrics
In the OCI Free Tier, specific high-level dashboard features (like those in Management Dashboard or Log Analytics) are gated behind an “upgrade” prompt because they offer enterprise features like cross-tenancy sharing or advanced log filtering.
To stay completely free, follow these steps using the Metrics Explorer and Console Dashboards.
Metrics Explorer: Correlate Metrics with Queries
System metrics (CPU/RAM) live in oci_computeagent namespace, while our Python script is pushing data to llama_custom. To correlate our llama-server performance with system resources, we will build a unified dashboard to bring these two different namespaces into a single visual view. For example, putting System (CPU/RAM) and App (Llama) metrics in the same chart.
Console → Observability & Management → Monitoring → Metrics Explorer.
Query 1 (System CPU):
- Pick your compartment
- Metrics Namespace:
oci_computeagent - Metric Name:
CpuUtilization - Dimension:
instance= (Select your Instance OCID)
Query 2 (Llama Metrics):
Now, add the data our Python script is sending to see how the LLM activity affects the hardware.
- Click Add Query.
- Pick your compartment
- Namespace:
llama_custom(the namespace from our Python script). - Metric Name:
rt_gen_tps - Dimension:
instance= (Select your Instance OCID)
Click Update Chart to see chart on top.
When you hover over the chart, you will be able to see “Correlated Tooltips”, a combined tip with data points from different metrics aligned.
Since the metrics are time-series data, they update in real-time. You can set the Quick Selects to “Last hour” and observe that it auto-refreshes. Now we can monitor patterns such as:
| Symptom | Chart Observation | Likely Cause |
|---|---|---|
| High Latency | High CpuUtilization + Low tokens_per_second |
Model is too large for CPU; context filling is slow. |
| Stream Fluctuation | CpuUtilization stays at 100% even after a prompt finishes |
llama-server might be hung or performing heavy “KV Cache” shuffling |
| Memory Crash | MemoryUtilization > 95% then drops to 0 |
OOM (Out of Memory) service stopped llama-server. |
| Memory Leak | MemoryUtilization goes up over 24 hours without coming down |
Need to investigate with top for culprit, or restart the service daily |
| Inefficient prefill phase | rt_prompt_tps is lower than usual |
Your prompt might be extremely long, or your CPU is struggling with the initial “reading” of the text. |
| Inefficient decode phase | rt_gen_tps drops below 3.0 |
The user experience will feel “choppy” and slow. This is a sign that the model is too large for the available RAM/CPU or that other background processes are interfering. |
Notice that you cannot save your queries or dashboard for future use. A hack is to save the exact state of the Metrics Explorer as a browser bookmark. OCI encodes the compartment, metrics, and dimensions directly into the URL. Whenever you click that bookmark, it will load the real-time overlaid chart.
Console Dashboard: Customize Widgets
The new Console Dashboard allows you to build your own dashboard. Its strength is at presenting multiple, related data points side-by-side using separate, configurable widgets, allowing you to see related metrics for the same context.
For example, you can set Filter by time to Past hour on both widgets in the canvas. This ensures the timelines match exactly. When you see a spike in CPU on the left chart, you can look at the same timestamp on the right chart to see the token speed.
Each Monitoring widget supports only a single query to 1 metrics. You cannot overlay multiple metrics in the same widget like Metrics Explorer.
Build the Dashboard
Create New Dashboard
- Click the Search Bar in the Console.
- Type
Dashboards. You should see Dashboards Home. Click to open it.
- Click Create New Dashboard.
- Choose Build from scratch (not from a template)
- Name:
Llama Monitor - Description:
Correlation of CPU, RAM, and Llama Metrics - Choose a compartment.
- Create a new Dashboard group
- Click Create. You now have a blank canvas.
Add Widgets:
- Click +Add Widgets button. .
- Click Monitoring widget from the “Add new widget” list.
- Once the widget appears on the dashboard, click Configure
- Select your region
- Metrics Namespace:
oci_computeagent - Metric Name:
CpuUtilization - Dimension:
instance= (Select your Instance OCID)
- Select your region
- Add another Monitoring widget and this time, add from :
- Namespace:
llama_custom(the namespace from our Python script). - Metric Name:
rt_gen_tps - Dimension:
instance= (Select your Instance OCID)
- Namespace:
Place two widgets side-by-side. Since both widgets use the same and Filter by time (Past hour), the peaks and valleys will align perfectly as you scroll horizontally.
Grafana to the Rescue!
Since the OCI Console Dashboard does not support overlaying different namespaces in a single widget, and the Metrics Explorer doesn’t support saving dashboards, we will use Grafana, a visualization tool that connects to databases (like Prometheus or OCI Monitoring) to build highly customizable dashboards. It allows you to pull OCI-native metrics (like RAM/Disk) and Custom metrics (our script) into the exact same graph with dual Y-axes. Now we will have a solution that gives us real-time, persistent, and overlaid dashboards! For example, Grafana allows us to build panels organized by these areas:
- User Experience: (TTFT, Success Rate).
- Model Performance: (TPS, Token usage).
- Infrastructure: (VRAM usage, CPU load).
Why Grafana is better than OCI tools
- Precision: We can zoom in on a specific 5-second window to see exactly how much CPU a 4,000-token prompt used.
- Persistence: Our dashboard is saved as a local file on our VM, so it never disappears.
- Real-time: We can set the dashboard to refresh every 5 seconds.
Our workflow will be:
- Install Grafana: Run Grafana in a Docker container or as a standalone service on our VM.
- Add OCI as a Data Source: Use the OCI Metrics Data Source plugin for Grafana to pull data directly from OCI Monitoring for free..
- Authentication: Use the same Instance Principal logic (Dynamic Groups) we used for our Python script.
- Build the Dashboard:
- Overlay: Grafana allows you to mix
oci_computeagent(CPU) andllama_custom(Tokens) on the same graph with dual Y-axes effortlessly. - Real-Time: Set the dashboard refresh rate to 5 or 10 seconds.
- Persistence: Dashboards are saved as JSON files locally on your VM.
- Overlay: Grafana allows you to mix
Install Grafana on VM
Connect to Ampere A1 instance via SSH and run
sudo dnf install grafana -yReload
systemdand start the service. Retart and enable the service so it runs on bootsudo systemctl daemon-reload sudo systemctl enable grafana-server sudo systemctl start grafana-serverVerify it is running with
sudo systemctl status grafana-serverInstall the OCI Metrics Plugin
Grafana needs a specific plugin to talk to OCI. To pull your
llama-servermetrics and CPU/Memory data into Grafana, install the OCI plugin on the headless VM:sudo grafana-cli plugins install oci-metrics-datasource sudo systemctl restart grafana-server
Open Network Access
By default, OCI blocks external access to port 3000 (Grafana’s port). We must open this in the OCI Console and VM firewall.
OCI Console: Go to Networking > VCNs > [Your VCN] > Public Subnet > Default Security List.
Click Add Ingress Rules:
- Source CIDR:
0.0.0.0/0
- IP Protocol:
TCP - Destination Port Range:
3000
- Source CIDR:
Oracle Linux uses
firewalldby default. We must open port 3000 locally on the VM, in addition to the OCI Security List rule we created earlier.sudo firewall-cmd --permanent --add-port=3000/tcp sudo firewall-cmd --reload
Access and Configure the Data Source via Local Browser
Since our Ampere VM is headless, we don’t need a browser on the VM. Grafana runs as a web server on the VM, and we can access its interface using the browser on our local computer by navigating to the VM’s Public IP address.
- Log in at
http://<vm_public_ip>:3000- Username:
admin - Password:
adminIt will ask you to change this immediately. Change to a stronger password.
- Username:
- Go to Home > Connections > Data Sources > Add data source.
- Search for Oracle Cloud Infrastructure Metrics.
- Set Authentication Provider to OCI Instance Principals. (This uses the Dynamic Group/Policy we already created.)
- Select your Region (e.g.,
us-phoenix-1).
- Select your Region (e.g.,
Save Dashboard
In “Edit Panel” Mode: If you are currently changing a specific chart’s query or axis, click the Apply button in the top-right corner.
Note: Clicking Apply only saves changes to that specific panel’s temporary state. You still have to save the whole dashboard using Save.
In “Dashboard” View: If you are looking at all your charts at once, the Save Dashboard icon (a floppy disk) is in the top toolbar, next to the settings cog icon.
Step 5: Automate Notifications
We might want to be informed if the VM is choking or if a user is sending massive prompts that exhaust our system resources. The free-tier OCI Notification is a great help here!
Notifications is a Publish/Subscribe Model that decouples message producers from consumers using Topics. Users create Topics, subscribe endpoints (like emails or functions) to those topics, and then configure event rules or alarms to publish messages to the topics, enabling automated responses and real-time monitoring of cloud resources. It integrates with OCI Monitoring, Events, and Service Connector Hub for broad visibility, and delivers messages securely and reliably, even during traffic spikes.
Common uses include:
- Alerts: Get notified when OCI alarms are breached (e.g., high CPU usage).
- Event-Driven Automation: Trigger an Oracle Function when a resource starts/stops.
- Infrastructure Updates: Receive alerts for system health issues or maintenance.
There are 3 pieces in Notification: topic, subscription and alarms. We will set them up respectively in the following steps:
Create a Topic
Topic is a logical channel to send messages.
- Console → Observability & Management → Notifications → Topics → Create Topic (e.g.,
llama-alerts).
- Create a Topic with name
llama-alerts.
- Console → Observability & Management → Notifications → Topics → Create Topic (e.g.,
Add Subscriptions
Register your endpoints to the topic. It supports multiple delivery protocols: Email, SMS, Slack, PagerDuty, custom HTTPS endpoints, and Oracle Functions.
- Console → Observability & Management → Notifications → Subscriptions -> Create Subscriptions
- subscription topic:
llama-alerts - Protocol: Email
- Enter your own email.
- You will receive an email to confirm the topic subscription. Click to finish setting it up.
Define an Event/Alarm
Set up a rule in OCI Events or Monitoring for specific actions or conditions (e.g., “instance stopped”). This can be done in 2 ways.
- Console → Observability & Management → Monitoring → Alarm Definitions → Create Alarm
- Setup directly in Metrics Explorer’’s Query editors.
Let’s take the first route:
In Alarm Definitions, click Create Alarm:
- Namespace:
oci_computeagent - Metric:
MemoryUtilization. - Trigger rule:
> 90%, trigger delay for 5 minutes. - Destination:- Notifications: send to topic
llama-alerts. - Click Save alarm.
Create another alarm when token generation speed fluctuates too much.
- Namespace:
llama_custom - Metric:
tokens_per_second - Trigger rule: :
< 5(meaning the server is struggling). - Destination:- Notifications: send to topic
llama-alerts. - Click Save alarm.
When the event triggers, a message is published to the topic, and OCI delivers it to all subscribers.
Next Step
I have just sratching the surface for what the free-tier OCI Observability can do for monitoring our server and application health. By implementing custom metrics (via Python/Grafana), we built a real-time dashboard showing the vital signs of our VM and inference server.
To summarize, we’ve visualized both system and custom metrics via these 3 tools:
| Feature | OCI Console Dashboards | Metrics Explorer (Bookmark) | Self-Hosted Grafana |
|---|---|---|---|
| Overlays | Limited (Side-by-side) | Yes (MQL) | Yes (Native) |
| Real-Time | Yes (1m refresh) | Yes (Manual/Auto) | Yes (High frequency) |
| Save Dashboard | Yes (Manual setup) | Yes (Via URL) | Yes (Permanent) |
In my next posts, I will dive into logging and individual request tracing to surface more patterns such as:
Prompt memory/CPU hotspots: log prompt length and category, query p95 TTFT grouped by category, correlate between prompt length/patterns and resource usage
User behavior: track what kind of prompts users issue and results, count requests per user_id, failure rates, latency distribution.
Distributed Tracing: Use OpenTelemetry to standardize logs, metrics, and traces, and perform lifecycle tracing with Jaeger or Tempo. When a user clicks “Submit,” a single ID follows that request through the frontend, into the backend, and through the inference process. Using this approach, when we notice the LLM being slow, instead of puzzling if it was due to inefficient frontend code or the quantized model, an OpenTelemetry pipeline can decouple and measure each stage of the request lifecycle, pinpointing the exact bottleneck for fixing.
Semantic Monitoring: logging the prompts and responses to check for:
- Sentiment Drift: Is the model getting more frustrated/toxic over time?
- Hallucination Benchmarking: Using a library like
RagasorArize Phoenixto grade the quality of the answers.
Since monitoring data are only stored for 90 days in OCI’s internal data store, I will also look into persistent storage for long-term analysis using external services such as OCI Object Storage or Oracle Autonomous Database for advanced querying and visualization.
Stay tuned!