When you spend your professional life managing software and product lifecycles, you naturally bring those habits into your volunteer work. Recently, I kicked off an initiative to design a comprehensive member needs assessment for our local non-profit board. Surveying approximately 500 members with a multi-area, 30+ question structure requires navigating the fine print of free-tier feature sets.
As I’ve evaluated a lot free tier development tools before, this comes as a second nature - How to scout for a tool that provides the exact feature set, that adapts to your needs today and scales reasonably well in the near future? This is essential not just for solo entrepreneurs and NPOs, but also for enterprise teams bootstrapping a new project. You never want to commit on procuring something big in the early stage of testing out an idea and rapid prototyping.
As always, no tool is perfect. Everything is a game of trade-offs. Navigating the current landscape to find something that balances our needs with a smooth experience for our members took a bit of trial and error.
This is the exact same friction we manage in our day job: ruthless scoping against hard resource constraints, balancing stakeholder alignment with user empathy, and making zero-budget decisions that still yield enterprise-grade data.
In this post, let’s take a look at how available offerings (in July 2026) stack up against our non-negotiable product requirements, as well as how you can create a data analytics pipeline after your survey closes.
TL;DR
Here’re my top 3 choices:
Pick Fillout if your absolute priority is a slick, modern user experience (for both yourself and respondents), complex logic, a vast amount of question choices, multi-seat collaboration and a robust AI agent.
This is the tool I’ve chosen for my upcoming survey. Even though the analytics in the free-tier is quite basic, since I am integrating it with Google Sheets (and Lookout Studio), this isn’t a problem for me.
Pick Tally if you’re a solo builder, expect an unpredictable or massive volume of raw responses, and want a fast, minimalist, Notion-like writing experience.
I am really impressed by the onboarding process of Tally. Silky smooth without the need to create yet another throwaway account, and immediately can prompt its AI editor to create a simple yet functional survey in less than a minute!
Pick Google + Looker Studio if your team already live inside Google Drive, you don’t want any caps, you don’t mind a slightly “no-frills” design on the form itself, and want to build highly tailored, multi-variable BI dashboards for a data-loving team.
Not many people are without a Google account, and the possibility that your data or crafted forms will vanish is practically zero. Plus, once you get onto Looker Studio with its no-code drag-n-drop editor, pivoting data against different dimension feels like fun to me! I have been a user of Data Studio (the former name of Looker Studio) for years and just think it’s a no-frill, very solid BI tool.
Even if you choose Fillout, Tally or any other tools that are more feature-rich than Google Forms, I still encourage you to take a serious look at Looker Studio. Trust me, it is spreadsheet on steroids with its default charting offerings and you can flex it (multi-pivots) in so many usage scenarios. I’ve used it for health tracking, personal improvement metrics and NLP data dashboards and it has proven to be a very versatile tool.
Project Requirements
To successfully pull off this study without a budget, I evaluate a tool against several non-negotiable baselines:
- Genuinely Free: Permanent free tiers, not time-limited trials or bait-and-switch plans. Most platforms claim to be “free,” but hide essential workflow tools behind heavy paywalls the second your survey scales.
- Multi-Seat Collaboration: Multiple editors can access the backend simultaneously so fellow board members can build and own their respective sections (e.g., conservation, field trips, membership).
- Image-Based TOC Navigation: Visual Table of Contents section cards so respondents can seamlessly jump to the areas of study most relevant to them, and skipping the rest.
- Advanced Logic: Smart conditional routing and question branching to prevent survey fatigue.
- Clean, modern UX: Professional and intuitive interface both for the editor and the survey, with clean color theme and user flow. Avoid forms that look like classroom projects.
- Enterprise-Grade Scale: Support at least 500 completed responses and 30+ questions spread across multiple sections. To remain flexible for future needs, the ability to scale out and run multiple follow-up surveys beyond the existing membership within a single month is a must.
- Granular Analytics & BI Dashboards: Native tools or clean export layers capable of generating boardroom-ready visualizations, trend tracking, and multi-pivot reporting for user research and actionable reports.
- Strict Data Privacy: Full compliance with my NPO’s privacy policy to safeguard member emails and personal identifiable information (PII).
- High User-Friendliness: Highly accessible, responsive, and cross-device compatible (mobile and desktop) layouts.
- Workflow Automation: Tight integrations with third-party tools (spreadsheets, CRMs, email services) to automate post-survey workflows.
- AI-Powered Bootstrapping: An AI agent capable of parsing intent, text prompts or uploaded documents to automatically draft questions, formats, and answer options. This speeds up the whole process for both tech and non-tech creators.
Note on Aesthetics: The total number of generic templates a platform offers doesn’t matter when I am using an AI builder to bootstrap the structure. I only need the flexibility to apply cohesive color templates and typography that match the “ambience” of my study’s audience.
My Notes on the Top Contenders
Free plan limits shift constantly. Legacy brands like SurveyMonkey may have high name recognition, but their free tiers are functionally unusable for serious work (capping you at 10 questions, 25 responses, and locking text/CSV exports entirely).
If you are running an incredibly brief, single-section internal poll or a straightforward event RSVP without branching logic, a simple tool such as Google Forms or Microsoft Forms would suffice. However, their free plan lacks AI agents, and a multi-editor, multi-section NPO assessment requires specialized architecture.
Here are my top 3 picks for my scenario. A comprehensive matrix highlighting strengths for more candidates can be found in the appendix.
1. Fillout: Best for Pacing, Design and Conversion Optimization
From a user experience and systems standpoint, Fillout offers the absolute highest feature density on a free tier. If you want the survey to actually look professional and keep people from quitting halfway through, this is your winner.
- Team Access: It allows your whole team to jump in and edit for free. One person can work on the content offering page while another refines the conservation page, which saves a lot of back-and-forth messaging.
- Respondent Cognitive Load (UX): With both an AI agent and a drag-and-drop form builder, I can easily builds gorgeous multi-page forms with image-based section cards combined with conditional rules, making a true visual Table of Contents. If a member clicks on a specific initiative card, conditional logic seamlessly guides them through the relevant pages, skipping the rest.
- Logic & Fields: Best-in-class conditional branching, answer piping (carrying text from a previous answer into a later question), partial submission tracking, and over 40 distinct field types.
- The Conversion Dashboard: Natively provides a real-time funnel view displaying Views vs. Starts vs. Submissions. For an NPO tracking down survey responses, this tells you if your email subject line worked but your page layout turned people away.
- The AI Credit Constraints & The Bridge Workaround: Its AI engine is the best I’ve tried for BOTH taking initial prompts/files and continuing working with you in existing forms. However, its monthly free AI credits are highly restrictive. To give you an idea, I used up my monthly credits with a single 20-question multi-page build.
As Fillout allows importing from Typeform (not free), Jotform, SurveyMonkey and Google Form, you can get around this by: - Paste your raw text or question list into SurveyMonkey’s AI prompt builder to quickly generate the baseline survey questions and options. - Open Fillout, click + Create a Form, select Import existing form, choose SurveyMonkey, and follow the instruction to authenticate with your SurveyMonkey account and pull the new form.
- Open the newly imported form in Fillout. Hold down the Shift key and click or drag over all the generated questions to bulk-select them. - Press Ctrl + C (or Cmd + C), exit to your main dashboard, open your original target form, navigate to the exact section page you want, and press Ctrl + V (or Cmd + V) to paste everything in bulk.
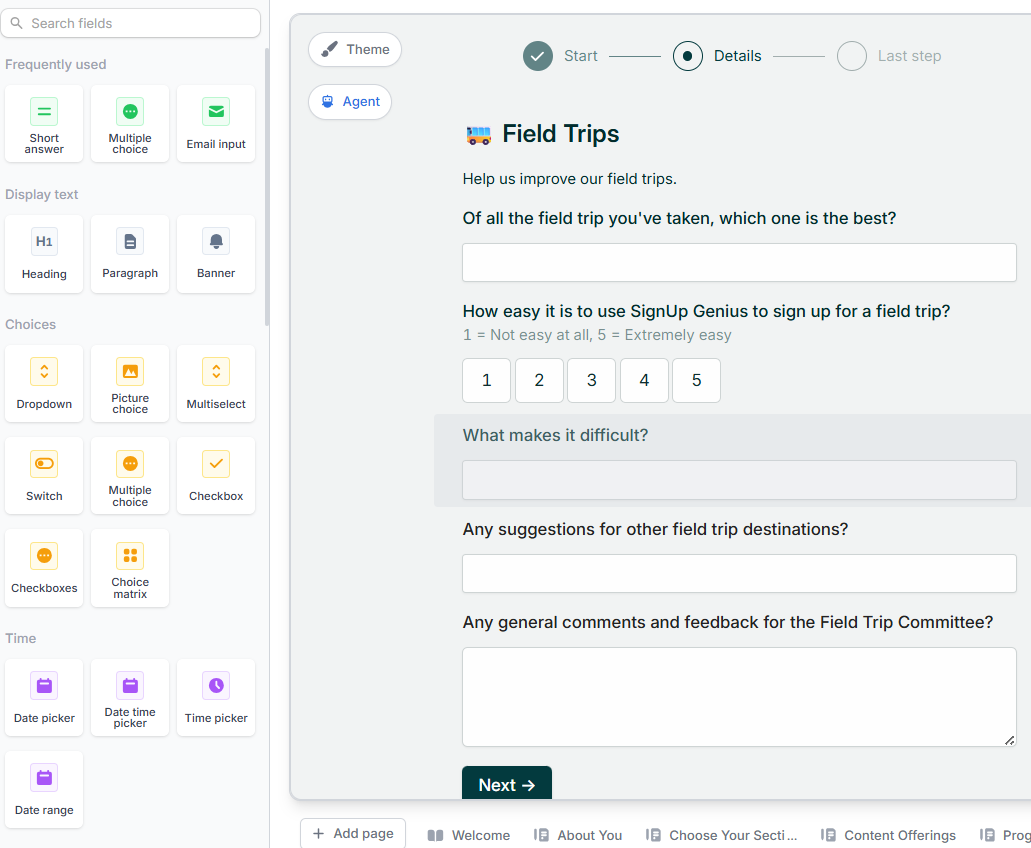
Fillout’s drag and drop editor makes adding blocks a breeze
2. Tally: The “Notion” of Forms
Tally is basically built for people who love the slash-command workflow. It’s incredibly fast and offers numerous features without a paywall.
In fact, I have test-driven them without even an account, by simply prompting their AI editor to create a new form, then use keyboard commands to refine.
As for data analytics, Tally keeps its reporting dashboard perfectly aligned with its minimalist writing interface. It focuses on clean, immediate clarity without cognitive overload.
- Total Peace of Mind: They are remarkably generous with their free tier. You get unlimited forms and unlimited responses.
- The UX Aesthetic: By using Notion-like slash (
/) commands, building a form is incredibly fast. It supports basic conditional logic, calculated fields, and answer piping out of the box. On the other hand, building a visual table of contents or more complex UI takes more manual effort since it is essentially a text editor, and I have to arrange images and button blocks myself rather than using a dedicated drag-n-drop UI-rich editor. - Out-of-the-Box Visualizations: Tally’s AI agent automatically parses multiple-choice, linear scale, and checkbox questions into clean, modern bar and pie charts. It is completely presentation-ready for standard status updates.
- Open-Text Management: For large open-ended sections (like community suggestions), Tally provides a clean, continuous scroll feed with a functional text-search filter. However, its free tier lacks advanced sentiment analysis or cross-tabulation. If you want to filter charts by specific user segments, you will need to leverage their CSV/Excel export function.
- The Hidden Trade-offs: Collaboration is a paid feature.
3. Google Forms + Looker Studio: The Reliable Pipeline and Infinite BI Canvas
Google Forms is a bare-bone engine, but it is completely unbothered by high response volumes, large team sizes and long-term data stability. In addition, its native, one-click connection to Looker Studio unlocks a level of analytics that no other free tier can touch.
- The Scalability Metric: Zero caps on questions, fields, seats, or response volume.
- The UX Trade-off: It is completely devoid of product design sophistication, with a very linear, basic experience. You don’t get advanced features like text piping (injecting a previous answer into a later question), no custom URL parameters to track which email campaign drove which response, and no fraud or duplicate submission detection.
- The BI Strategy: While native Google Form analytics are basic summary charts (for certain question types, such as multiple-choice, checkboxes, and linear scales) that cannot be easily grouped, sorted, or filtered, it functions as an excellent data ingestion layer. By piping the response spreadsheet into a free Looker Studio environment, we can unlock a level of analytics that no other free tier can touch:
- Cross-Tabulation & Multi-Variable Filtering: Want to see how members who answered “Yes” to volunteering in Region A feel about Program B? Or see how responses change based on a member’s specific region or membership history? Looker Studio allows you to build interactive drop-down filters that recalculate your entire survey data set on the fly.
- The Board Brief: You can map geographic zip codes into interactive Google Maps bubbles, create multi-page reports with custom brand styling, and set up automated PDF emails that send the live charts straight to your board members periodically.
4. AntForms & Formhug: Great for Data Insights
These platforms bypass standard free-tier traps by providing deeper operational metrics out of the box.
Formhug: Provides a generous 3,000 monthly response cap and supports an advanced Model Context Protocol (MCP) server. This lets external LLM agents programmatically structure or audit your forms from a side panel.
It also features the most detailed BI dashboard, with automated scoring and real-time trend panels that auto-calculate user affinity metrics. It also makes reading open-ended feedback much easier. Its dashboard is notable for a “Public Query” engine, allowing you to easily display a filtered, read-only version of your survey results back to your community via a secure link.
AntForms: Eliminates response caps entirely while offering deep product-analytics data on the house. Includes real-time response trends over time, completion rates, and most importantly per-question drop-off metrics (showing us the exact spot where people lost interest) completely free. If 40% of your users drop off when asked for an address or phone number, you can instantly pivot and make that field optional. Its dashboard charts auto-generate split-views for multiple-choice data, allowing you to see rolling trend lines without manual plotting.
What’s Next: Turning Data into Actual Moves
Collecting data is only half the project; the real goal is revealing user behavior to influence policy making, which ultimately foster a better community.
Here are a few ideas that I plan to implement once the project takes off.
Data Strategy
To maximize ROI and efficiency, we should identity integration opportunities to build a unified data workflow. Our data strategy must serve two distinct internal customers: our internal operations and our end members.
                  ┌───────────────────────────────┐
                  │   Member Completes Survey     │
                  └───────────────┬───────────────┘
                                  │
                                  ▼
                  ┌───────────────────────────────┐
                  │ Webhook Triggers Automations  │
                  └───────────────┬───────────────┘
                                  │
            ┌─────────────────────┴─────────────────────┐
            ▼                                           ▼
┌───────────────────────┐                   ┌───────────────────────┐
│     NPO OPERATIONS    │                   │   MEMBER EXPERIENCE   │
└───────────┬───────────┘                   └───────────┬───────────┘
            │                                           │
            ▼                                           ▼
┌───────────────────────┐                   ┌───────────────────────┐
│ Looker Studio Syncs   │                   │ Personalized Segment  │
│ Multi-Pivot Dashboard │                   │ Email Triggered       │
└───────────┬───────────┘                   └───────────┬───────────┘
            │                                           │
            ▼                                           ▼
┌───────────────────────┐                   ┌───────────────────────┐
│ Identify Churn Risk   │                   │ Deliver Immediate Info│
│ & Resource Demands    │                   │ & Resource Matching   │
└───────────────────────┘                   └───────────────────────┘
1. Internal NPO Operations (Data-Driven Administration)
One perpetual battle for an NPO is the resource strain (board members, volunteers, budgets, assets) vs member needs in a rapidly changing environment. A periodic tally of what we invest in vs. the results we get (community participation, member satisfaction, outreach, policy) acts as a healthy checkup.
Survey-specific Analytics: Build dashbaords around:
- response overview charts
- section‑level breakdowns
- pivots based on demographic (audience segmentation - feeding into CRM)
- open‑text sentiment summary using external LLM provider
Tasks Resourcing: We can map member preferences to a quadrant analysis matrix. High-resource, low-satisfaction areas can be immediately flagged for future triage for the next fiscal year.
Churn Prevention Model: By cross-referencing volunteer drop-off questions against historical engagement, we can construct an early-warning dashboard identifying members with low affinity scores, triggering manual outreach from the board before they disengage entirely.
Identify and Nurture Leads: By integrating with a CRM and identifying non-members that frequent events and programs from RSVP data, we can entice them to join for full membership. We can also track active participants in initiatives to develop deeper relationship and nurture future leaders.
2. External Member Experience (Personalized Engagement)
Watching for Friction: Use whatever native analytics my chosen tool provides to check the drop-off rate. If I notice a big dip on a question where people have to type a long text answer or give personal contact details, make that field optional right away.
Personalization: Choose a tool that supports conditional webhooks or automated email routing. If a member flags an interest in Conservation, an automation flow can automatically send them an email with resources on that topic.
The “We Heard You” Loop: Within a month after the survey, share a “We Heard You” summary with the members. Show them the top 3 takeaways and what the board plans to do about them. This transparent operational loop shows people that taking the time to share their thoughts actually led to real action. It directly boosts community retention and response rates for subsequent studies.
Appendix: Strategic Trade-Offs Matrix
Here’s how I rank the top contenders across specific operational strengths, in descending order:
| Platform | Multi-Seat Collaboration | Scale (30+ Q, 500+ Responses) | Image-Based TOC & Nav | Conditional Logic | AI Agent Core | Drag & Drop UI | BI Analytics & Reporting | Workflow Integrations |
|---|---|---|---|---|---|---|---|---|
| Fillout | ✓ Unlimited Seats | ✗ Capped at 1,000/mo | ✓ Visual Section Cards | ✓ Best-In-Class + Piping | ✓ In-Editor Assistant | ✓ Highly Polished | ✓ Drop-off funnel charts + CSV | ✓ Direct Native Integrations |
| Tally | ✗ Paid Paywall | ✓ Unlimited | ✗ Inline Images Only | ✓ Basic Branching | ✓ Good for text prompts & MCP server, but unreliable PDF Parse | ✗ Slashing / commands |
✓ Clean Summary Charts | ✓ Standard Webhooks |
| Google Workspace | ✓ Native Collaboration | ✓ Unlimited | ✗ Standard linear pages | ✓ Basic Section Jumps | ✗ Add-ons Fail | ✓ Block Based | ✓ Looker Studio Connection | ✓ Unlimited Ecosystem |
| AntForms | ✗ Single Seat | ✓ Unlimited | ✗ Standard list view | ✓ Advanced | ✓ Basic Prompt | ✓ Intuitive | ✓ Drop-off & Field Metrics | ✓ Deep Webhooks |
| Formhug | ✓ Unlimited Seats | ✓ Capped at 3,000/mo | ✗ Page-breaks Only | ✓ Standard Logic | ✓ Full Prompt + MCP Agent | ✓ Standard | ✓ Deep analytics w/ Real-Time Trend Panels | ✓ Sheets & Webhooks |
| SurveyPlanet | ✗ Paid Paywall | ✓ Unlimited | ✓ Text Outline Only | ✗ Paid Paywall | ✗ Missing | ✓ Standard | ✗ Basic (No CSV Export) | ✗ Paid Paywall |
| Youform | ✗ Single Seat | ✓ Unlimited | ✗ Button Workaround | ✓ Math & Logic | ✗ Missing | ✓ Standard | ✗ Basic Analytics | ✓ Google Sheets |
| Jotform | ✗ Paid Paywall | ✗ Capped at 100/mo | ✓ Tab/Widget Navigation | ✓ Standard Logic | ✗ Static PDF Reader Only | ✗ Chunky / Laggy | ✓ Robust Report Builder | ✓ Robust Marketplace |
| SurveyMonkey | ✗ Paid Paywall | ✗ Capped at 25/form | ✗ Missing | ✗ Paid Paywall | ✓ Setup Prompt Only | ✗ Structural Friction | ✗ Blocked on Free Tier | ✗ Blocked on Free Tier |
| MS Forms | ✓ Standard Shared | ✗ Capped at 200/form | ✗ Missing | ✓ Basic Section Jumps | ✗ Missing | ✓ Grid Based | ✗ Basic Aggregates | ✓ PowerAutomate Heavy |